In
all graphs information
is often condensed
for specific world regions.
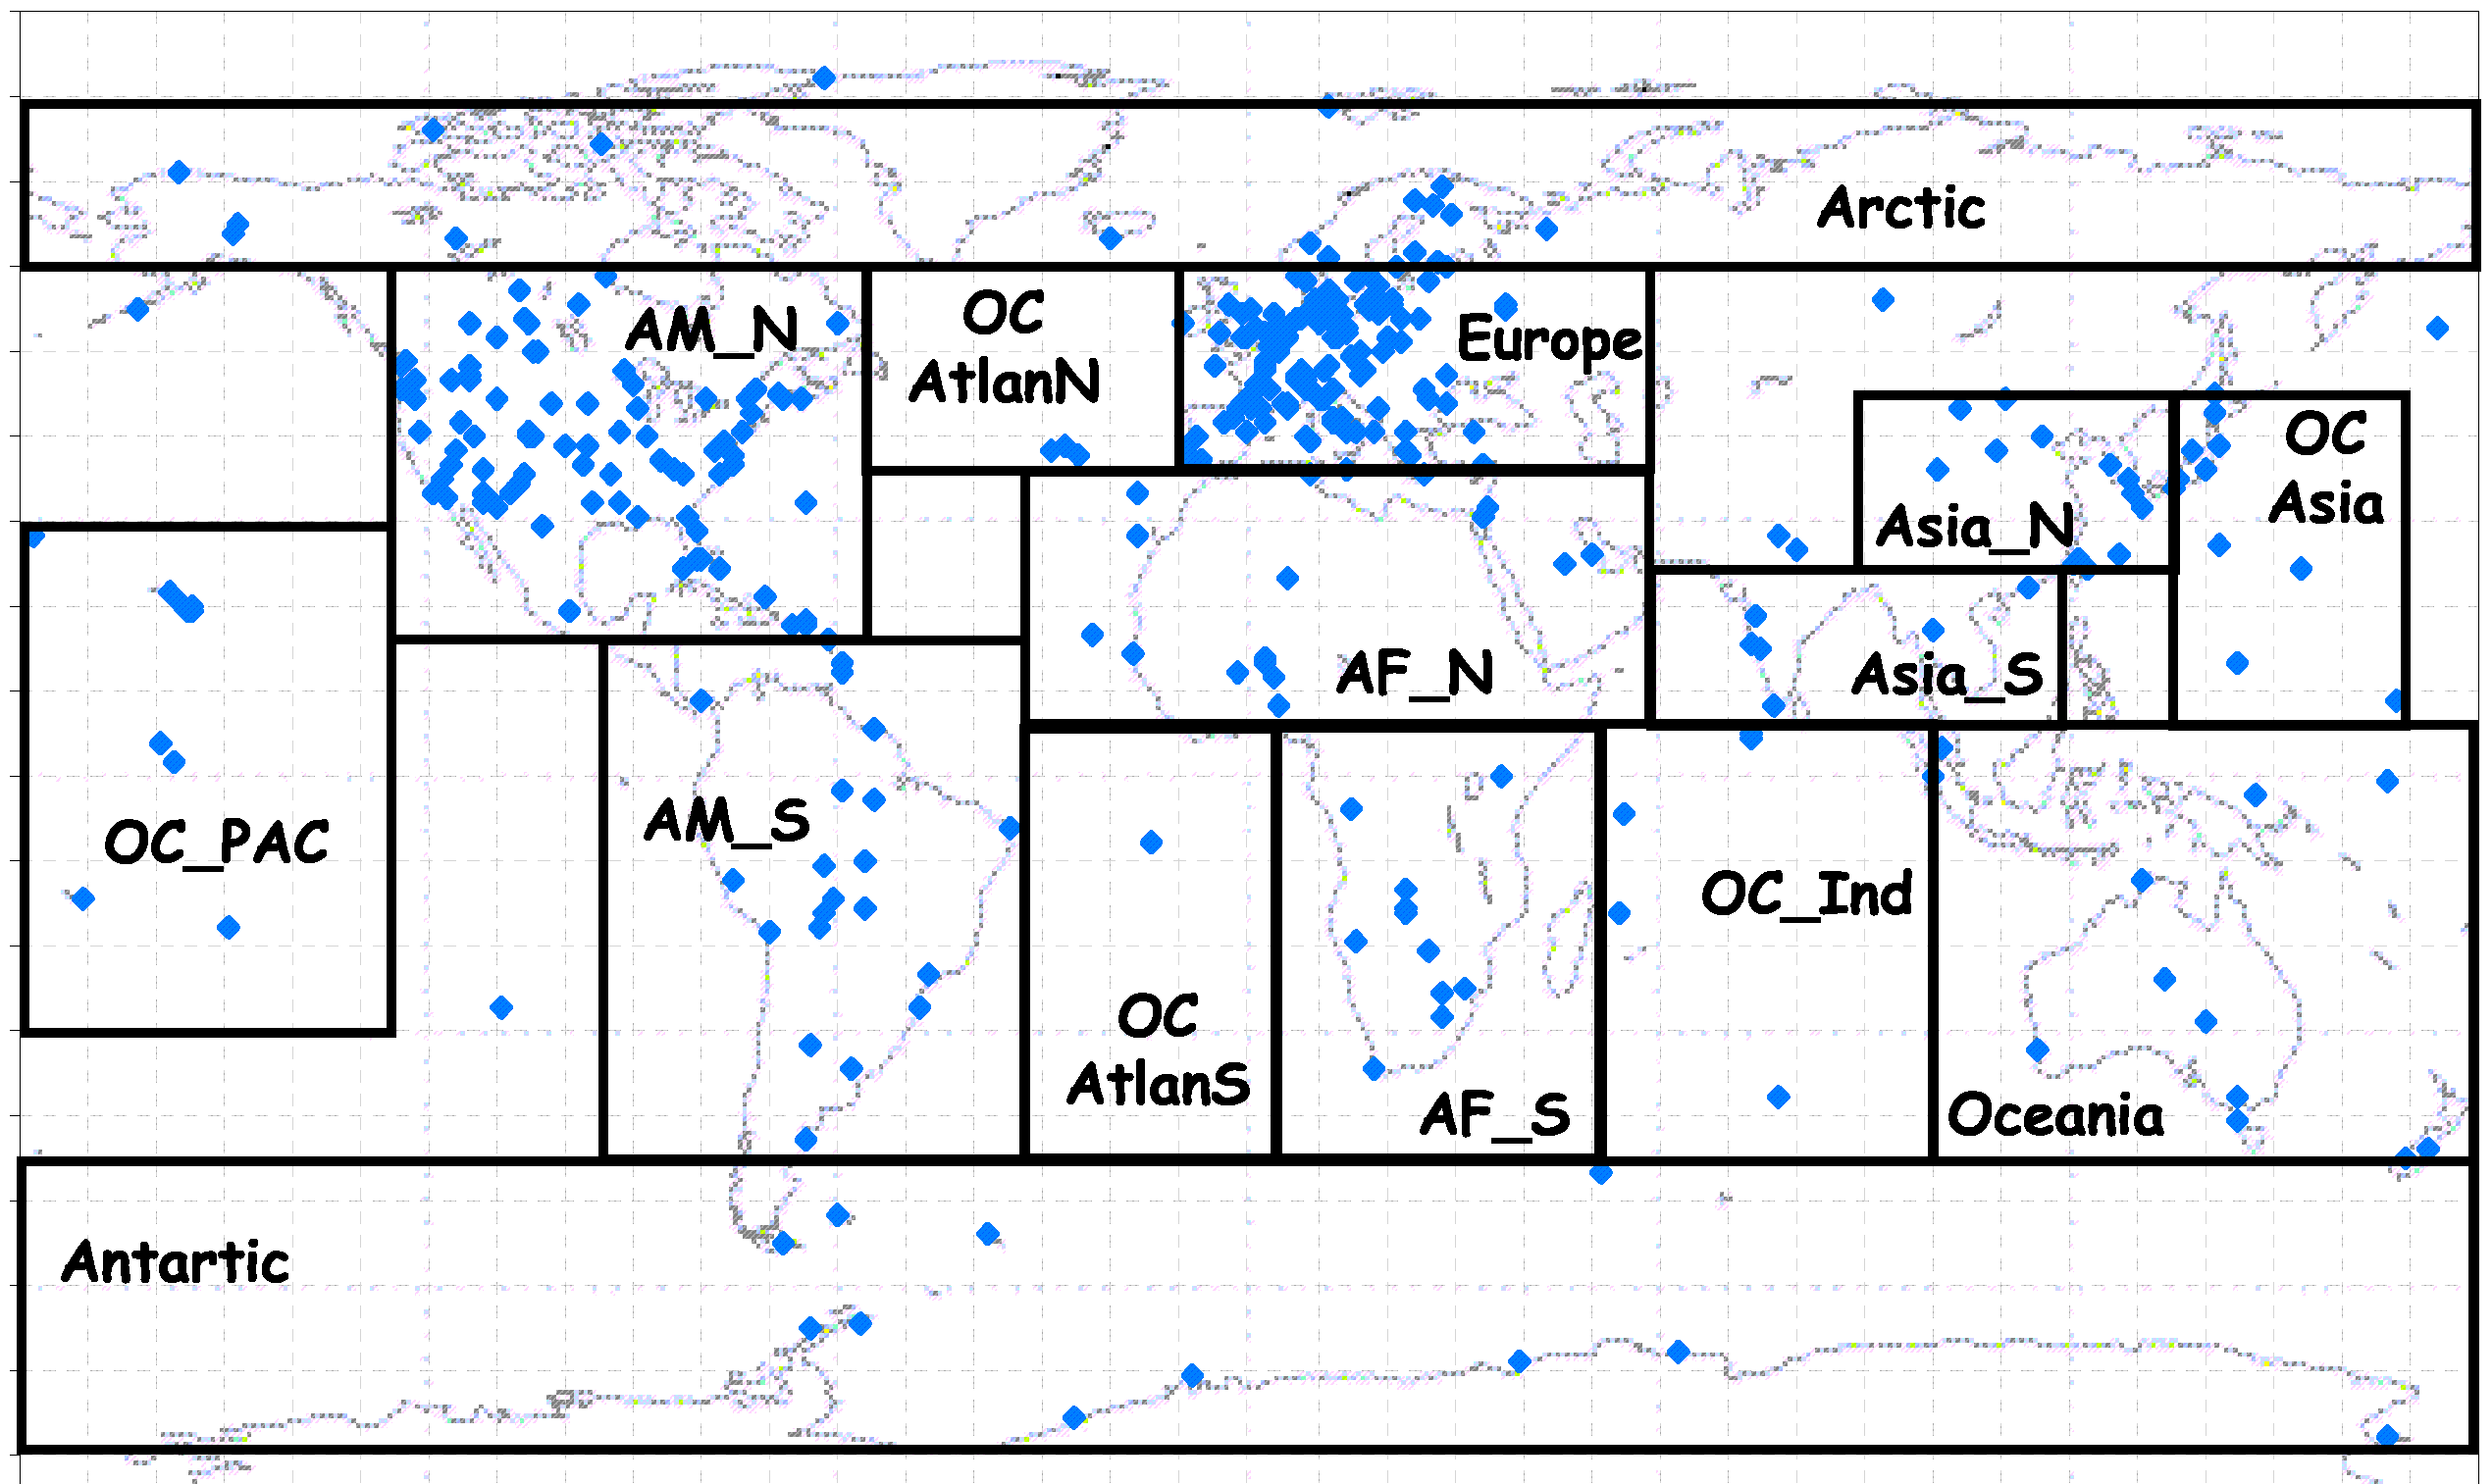
NOTE: Regions and their respective NAMES
are defined as shown to the left.
WORLD corresponds to global means
ALLREGIONS refers to graphs where
splits per region are used in onegraph
Aeronet, GAW, EMEP, IMPROVE, etc
station locations used in this analysis
are shown as blue dots.

Year(s) / Type of graph / Parameter / Region
an2000 / MODSAT / OD550AER / WORLD
MODSAT-type of graphs compare regional averaged of aerosol optical depth from MODIS and all AEROCOM models

Year(s) / Type of graph / Parameter / Region
an2000 / MODSAT / OD550AERMODELNAME / WORLD
this MODSAT-type of graphs compare regional averaged of aerosol optical depth from MODIS and a specific AEROCOM model

Year(s) / Type of graph / Parameter / Region
an2000 / SCAT / OD550AER / AFN
Summary of model vs surfobs-observation scatterplots
( see also MODEL versus SURFACE OBSERVATIONS WEB interface)
Per Region, regression lines are shown for all models vs observations
Kept in the legend are
slope values s=???
correlation coefficients r=???
> shows eg Model and MODIS versus AERONET aerosol optical depth
and Angstroem component in different regions, but also sutrface concentrations of sulfate, OC, BC ...

Year(s) / Type of graph / Parameter / Region
an96-02AVG / SCATCOEF / OD550AER / WORLD
Summary of model vs surfobs-observation scatterplots
( see also MODEL versus SURFACE OBSERVATIONS WEB interface)
Correlation coefficients and slope values are put on graph per model and region.

Scroll down menus
Year(s) / Type of graph / Parameter / Region
an2000 / SURFOBS / OD550AER / WORLD
Summary of model+satellite vs surfobs-observation
( see also MODEL
versus SURFACE OBSERVATIONS WEB interface )
SAME data as used in SCATCOEF
BUT box and whisker plots to show mean, median and variability of data
Available per region
and for all model and observational data sets
Note: Model means are for the same days and locations
than the observations

Year(s) / Type of graph / Parameter / Region
an2000 / SURFOBS / OD550AERMODELNAME / ALLREGIONS
Same as SURFOBS type of graph explained above
BUT comparison for all regions is shown for individual model
Note: Model means are for the same days and locations than the observations

Scroll down menus
Reference:
Year(s) / Type of graph / Reference data set / Region
an2000 / TAYLOR / OD550MODIS / WORLD
TAYLOR-type of graphs condense information
of correlation and spatio-temporal variability on one graph
Available for each region
-> analysis of model quality against
reference data set (observations but could also be another model data set)
Taylor, K.E., Summarizing multiple aspects of model performance in a single
diagram, Journal of Geophysical Research-Atmospheres, 106 (D7), 7183-7192,
2001.

Year(s) / Type of graph / ParameterMODEL / ALLREGIONS
an2000 / ABSOLUTMOD / EmiARQM / ALLREGIONS
Parameter name PLUS model name
gives acces to split of model property among different regions
one graph for each parameter-model combination
-> analysis of processes (sources and sinks) and load, od etc.

Year(s) / Type of graph / Parameter / regions
an2000 / ABSOLUTREG / Emi / WORLD
ABSOLUTREG-type of graphs
represent ABSOLUT annual means of Parameter with one
graph for each REGion
-> analysis of processes (sources and sinks) and load, od etc.

Year(s) / Type of graph / ParameterSPECIES / ALLREGIONS
an2000 / ABSOLUTSPEC / EmiAER / ALLREGIONS
ABSOLUTSPEC-type of graphs
represent ABSOLUT annual means of Parameter with one graph for each SPEcies
-> analysis of processes (sources and sinks) and load, od etc.

Year(s) / Type of graph / Processed Species / Region
an2000 / ANAOD / BCPOM / WORLD
ANAOD-type of graphs:
For Processed Species global annual mean of indidual model
is plotted as deviation from the median computed from all models
for each Processed Species one plot
-> model-model comparison: ANAlysis to explain differences in Otical Depth
for each species: emissions as a function of lifetime lead to load,
and that translates via optical calculation into od550

Year(s) / Type of graph / Processed Species / Region
an2000 / FRACTION / BCPOM / WORLD
FRACTION-type of graphs:
For Processed Species global and regional annual means of indidual model
Percentage Fractions of
a) Split among DRY+SED deposition vs WET deposition
b) Split of aerosol load in low level -- mid level -- high level atmospheric layers
WORLD plot: for each Processed Species one plot for the globe, ->load lifetime
Regional plots: with height distribution and split among deposition process
-> model-model comparison: Investigation of the vertical distribution of the aerosol
and of the split among the deposotion processes
to explain differences in life time

Scroll down menus
Year(s) / Type of graph / Processed Species / Region
an2000 / MODMEDIAN / BCPOM / WORLD
MODMEDIAN-type of graphs:
same as FRACTION type of graph
But plotted is Individual-model-value / Median-of-all-models for
emission, deposition, load and lifetime
PLUS
%low: mass fraction below 800mb of total load
%mid: mass fraction between 800 and 500 mb of total load
%high mass fraction above 500mb of total load
note that %low+%mid+%high=100% !
-> model-model comparison:
Investigation of the vertical distribution of
the aerosol
and of the split among the deposotion processes
to explain differences in life time